Dans le contexte actuel de transformation numérique, deux termes reviennent souvent : la numérisation et la digitalisation. Bien qu’ils soient souvent utilisés de manière interchangeable, il est essentiel de comprendre qu’ils désignent deux concepts distincts. Dans cet article, nous allons dissiper toute confusion en clarifiant les différences entre la numérisation et la digitalisation. La numérisation…
Lorsqu’il s’agit de travailler dans le domaine de l’informatique, l’importance de la documentation ne peut être sous-estimée. Elle est bien plus qu’une simple tâche administrative. La documentation joue un rôle essentiel dans la réussite d’un projet, la collaboration au sein des équipes et la garantie d’un flux de travail efficace. Dans cet article, nous allons…
Un regard personnel sur la mode madrilène Una mirada personal sobre la moda madrileña Il y a parfois des débuts qui ne doivent rien au hasard. A veces, los comienzos ocurren por casualidad, aunque parezcan escritos de antemano. J’ai commencé à photographier la mode à Madrid après avoir découvert, sur les réseaux sociaux, que des…
🗣️ En tant que Je souhaite Afin de 🏁 Situation actuelle ➡ 👩🏼🔧 Problématique métier/cas d’usage ➡ 🎯 Attendu ➡ 💻 Écran impacté 🖼 🧭 Règles de gestion fonctionnelles ➡ RG01 : 🖼 Règles de gestion d’interfaces ➡ RG01 : 🖼 Les gains sur l’expérience utilisateur ➡ 🎨 Maquette Penser aux impacts sur :
Moodboard qui initie mon projet d’étude sur le thème « la danse sublimée par l’image ». Capturer le mouvement Figer le mouvement Les arabesques La géométrie des corps, la perspective de l’objectif Les danseuses étoiles Amplifier le mouvement La danse inspire la peinture, la peinture inspire la photographie Les ballerines d’Edgar Degas recréées en photographie | Beaux…
Forecasting Energy with Machine Learning
☀️ Sun · ☁️ Clouds · 🌡 Temperature · 💨 Wind
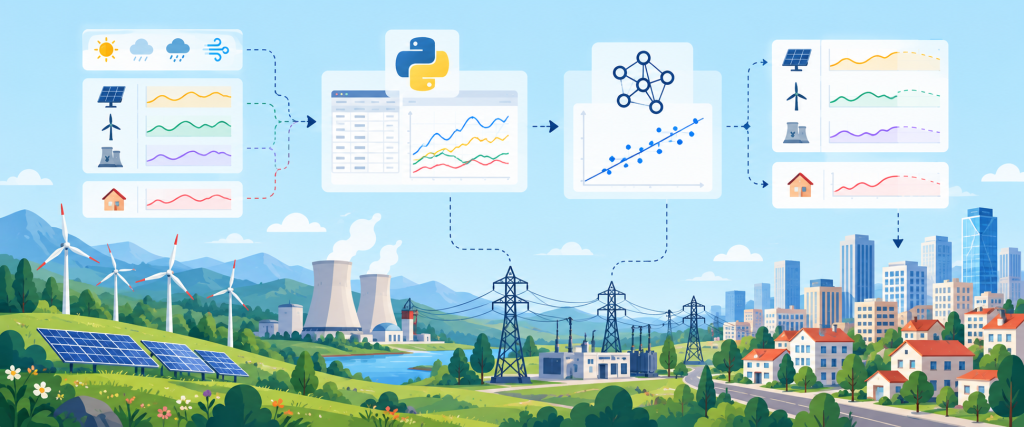
During my experience in Salamanca, I worked on a Machine Learning project focused on electricity production and consumption forecasting.
The project combined production data from solar panels, wind turbines and nuclear power plants with electricity consumption data from residential areas and historical Spanish weather data. By aligning these different time series through their timestamps, we could study how weather conditions influenced both energy production and consumption.
Using Python and Jupyter Notebook, I worked through the complete data pipeline: collecting, cleaning, merging and analysing the datasets before training Machine Learning models to predict future energy production and consumption.
Predicting electricity production and consumption through Machine Learning
Scientific literature review and methodological orientation
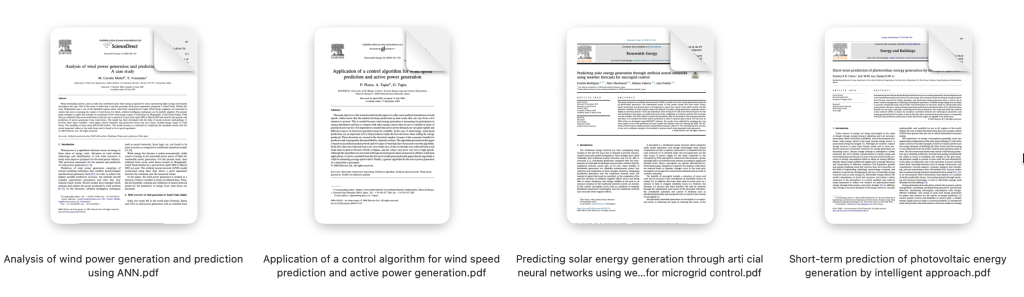
Before starting the data analysis and machine learning development, I conducted a review of scientific studies related to renewable energy forecasting, with a particular focus on photovoltaic and wind power generation.
The objective of this preliminary analysis was not to select a machine learning model immediately, but rather to understand the characteristics of the problem and identify the main factors that can influence renewable energy production. Four scientific papers were therefore studied in order to analyse the variables used, the data preparation methods, the forecasting approaches and the machine learning models adopted.
A common conclusion across these studies is that renewable energy production is strongly influenced by environmental and meteorological conditions and that these relationships are generally nonlinear. For photovoltaic systems, variables such as solar radiation, temperature, solar position and time-related information were identified as important parameters. The studies also showed that historical measurements and temporal information can be particularly relevant when performing short-term forecasting.
The literature review also highlighted the importance of data analysis before model training. The studies did not simply use all available variables. Instead, they analysed the relationships between the input variables and the target variable in order to identify the most relevant parameters. Correlation analysis, statistical analysis and sensitivity studies were used to determine which variables provided useful information for the prediction.
These findings directly influenced the methodology adopted in my own study. I started by exploring the available dataset and analysing the different variables individually. Temporal information was transformed into more meaningful features, such as hour, month and year, in order to investigate daily and seasonal patterns. I then analysed the distribution of the target variable, calculated descriptive statistics and investigated potential abnormal values.
The relationships between the meteorological variables and solar radiation were subsequently studied using graphical analysis and correlation matrices. For example, the relationship between temperature, humidity and solar radiation was investigated in order to determine whether these variables could provide useful information for prediction. This exploratory phase was important because it allowed me to compare the characteristics of my dataset with the observations reported in the scientific literature.
The literature review also influenced the way I approached data preprocessing. The scientific studies showed that renewable energy datasets may contain measurement errors, abnormal observations and variables with very different scales. Consequently, data quality, outlier analysis, feature selection and normalization were considered important steps before machine learning.
Another important consideration was the temporal nature of the forecasting problem. The final objective of the BISITE project is to estimate future energy production. Therefore, a variable can only be used as an input if it would realistically be available at the time when the prediction is made. This led me to distinguish between variables that describe known future conditions, such as time and solar position, historical observations, and variables that would only be available after the prediction period, such as the actual future solar radiation. This distinction is essential to avoid information leakage in the final model.
Finally, the scientific studies consistently demonstrated the potential of artificial neural networks and multilayer perceptrons for modelling nonlinear relationships between meteorological conditions and renewable energy production. This provided a scientific basis for considering neural networks as a candidate modelling approach for the BISITE project. However, the literature review was not considered sufficient to determine the final model. The model selection should ultimately depend on the characteristics of the available data and on an experimental comparison of the different approaches.
Therefore, the scientific literature review served as the starting point for the entire data science methodology. It allowed me to move from a general understanding of renewable energy forecasting to a structured data analysis process: understanding the physical phenomenon, identifying relevant variables, exploring their statistical and temporal relationships, assessing data quality, preparing the dataset, and finally selecting and evaluating an appropriate machine learning model.
In this sense, the literature review provided a methodological framework rather than a predefined solution. The subsequent exploratory analysis of the dataset was used to verify which of the observations reported in previous studies were applicable to the specific data available in the BISITE project.
01 — Collect the Data
The project relied on several complementary datasets:
Solar energy production
Wind energy production
Nuclear energy production
Residential electricity consumption
Spanish weather data
Historical timestamps
The challenge was not only to obtain the data, but to make these heterogeneous datasets compatible and usable together.
Solar Energy Production Dataset
The main focus of my work was the prediction of solar energy production. For this purpose, I selected the Solar Power Generation Data dataset available on Kaggle. It contains real production data from a photovoltaic plant equipped with 22 inverters, with measurements recorded every 15 minutes.
The dataset includes several production variables, mainly DC_POWER, AC_POWER, DAILY_YIELD and TOTAL_YIELD, as well as the DATE_TIME and SOURCE_KEY variables. These data make it possible to analyse both the electrical production and its evolution over time.
Since the measurements were initially provided separately for each inverter, I aggregated the data by DATE_TIME to obtain a global view of the photovoltaic plant. I also processed the temporal information by separating the date and time components.
I selected this dataset because it provides real measurements of photovoltaic production and a sufficiently detailed temporal resolution to study daily variations in solar energy generation. I also analysed other solar datasets and machine-learning notebooks to identify relevant variables and understand how data preparation and feature selection can improve the prediction process.
The resulting workflow was therefore:
Raw data → cleaning → inverter aggregation → temporal processing → feature selection → machine-learning model.
02 — Align the Time Series
Connecting energy and weather
The different datasets were linked through their timestamps, allowing us to associate electricity production and consumption with the weather conditions observed at the same time.
For example:
Date & Time → Weather Conditions → Energy Production / Consumption
This temporal alignment created a common dataset that could be used to study relationships between environmental conditions and energy behaviour.
Keywords: Time Series · Timestamp Alignment · Data Integration · Temporal Features · Correlation
03 — Clean & Prepare
Turning raw data into usable data
Before training any model, the datasets had to be cleaned, transformed and combined.
This included handling missing or inconsistent data, aligning time periods, transforming variables and preparing the final datasets for Machine Learning.
Keywords: Data Cleaning · Data Pre-processing · Data Transformation · Missing Values · Feature Engineering
04 — Explore the Data
Understanding the relationships
Using Python, Pandas, NumPy and Jupyter Notebook, I explored the datasets to understand how different variables were related.
For example, weather conditions could influence:
Sunlight → Solar Production Wind → Wind Production Temperature → Residential Consumption
This exploratory phase helped identify relevant features for the predictive models.
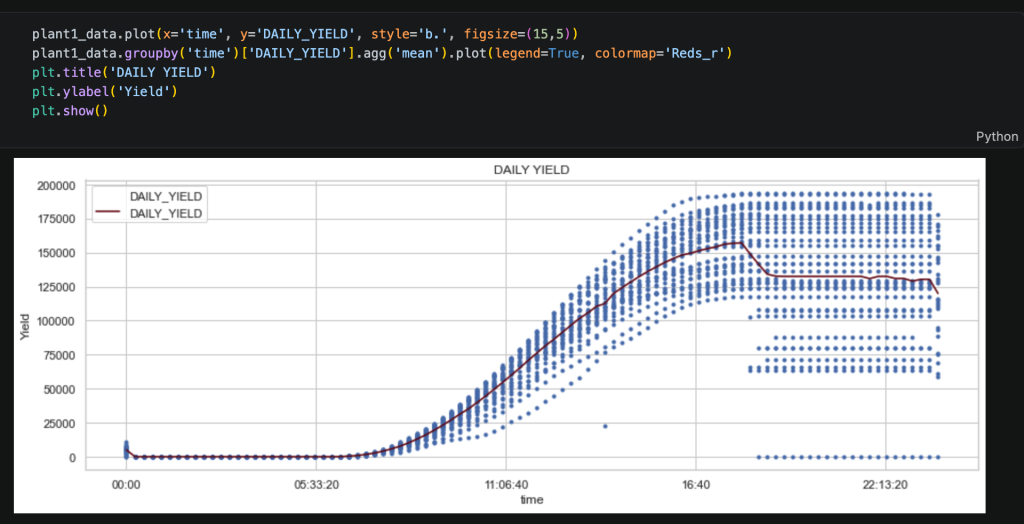
Before training a machine learning model, the first step is to understand the data. This visualization shows the evolution of the daily solar yield throughout the day. The blue points represent individual observations, while the red line shows the average yield for each time of day.
The visualization reveals a clear daily production pattern, but also significant variability between observations. This highlights an important point: time alone cannot fully explain solar power production.
Variables such as solar irradiance, ambient temperature, module temperature and the specific inverter or source therefore need to be investigated as potential predictive features.
This exploratory analysis helps guide the next steps: data cleaning, feature selection and machine learning model design.
05 — Train the Models
Learning from historical patterns
Once the datasets were prepared, Machine Learning models could be trained using historical observations.
The models learned relationships between weather conditions, historical energy behaviour and energy production or consumption.
The objective was to build models capable of estimating energy behaviour under different conditions.
Keywords: Machine Learning · Model Training · Regression · Feature Selection · Training Data
06 — Forecast Energy
From historical data to predictions
The final objective was to develop predictive algorithms capable of estimating:
Future Energy Production
and
Future Energy Consumption
based on available information such as weather conditions and historical patterns.
This could help anticipate variations in energy supply and demand and provide a foundation for more informed energy management and planning.
Keywords: Forecasting · Prediction · Energy Demand · Energy Production · Time Series
07 — Evaluate & Improve
Measuring and refining the predictions
The models were evaluated against known data to measure their predictive performance.
The results could then be used to refine the data preparation, feature selection and model configuration, creating an iterative Machine Learning workflow.
Data → Model → Prediction → Evaluation → Improvement
Working in consulting taught me that digital projects are not only about designing or developing a solution. They are about understanding a client’s needs, translating them into actionable requirements, coordinating different teams and delivering a reliable product within defined constraints.
Working in a service company also means constantly balancing business expectations, technical constraints, deadlines, quality and available resources. This experience strengthened my ability to prioritize, communicate with stakeholders and make sure that what is delivered is aligned with what was actually requested.
Key Challenges
Align business and technical teams
Prioritize according to business value
Ensure requirements traceability
Manage scope and dependencies
Ensure quality and compliance
Validate before delivery
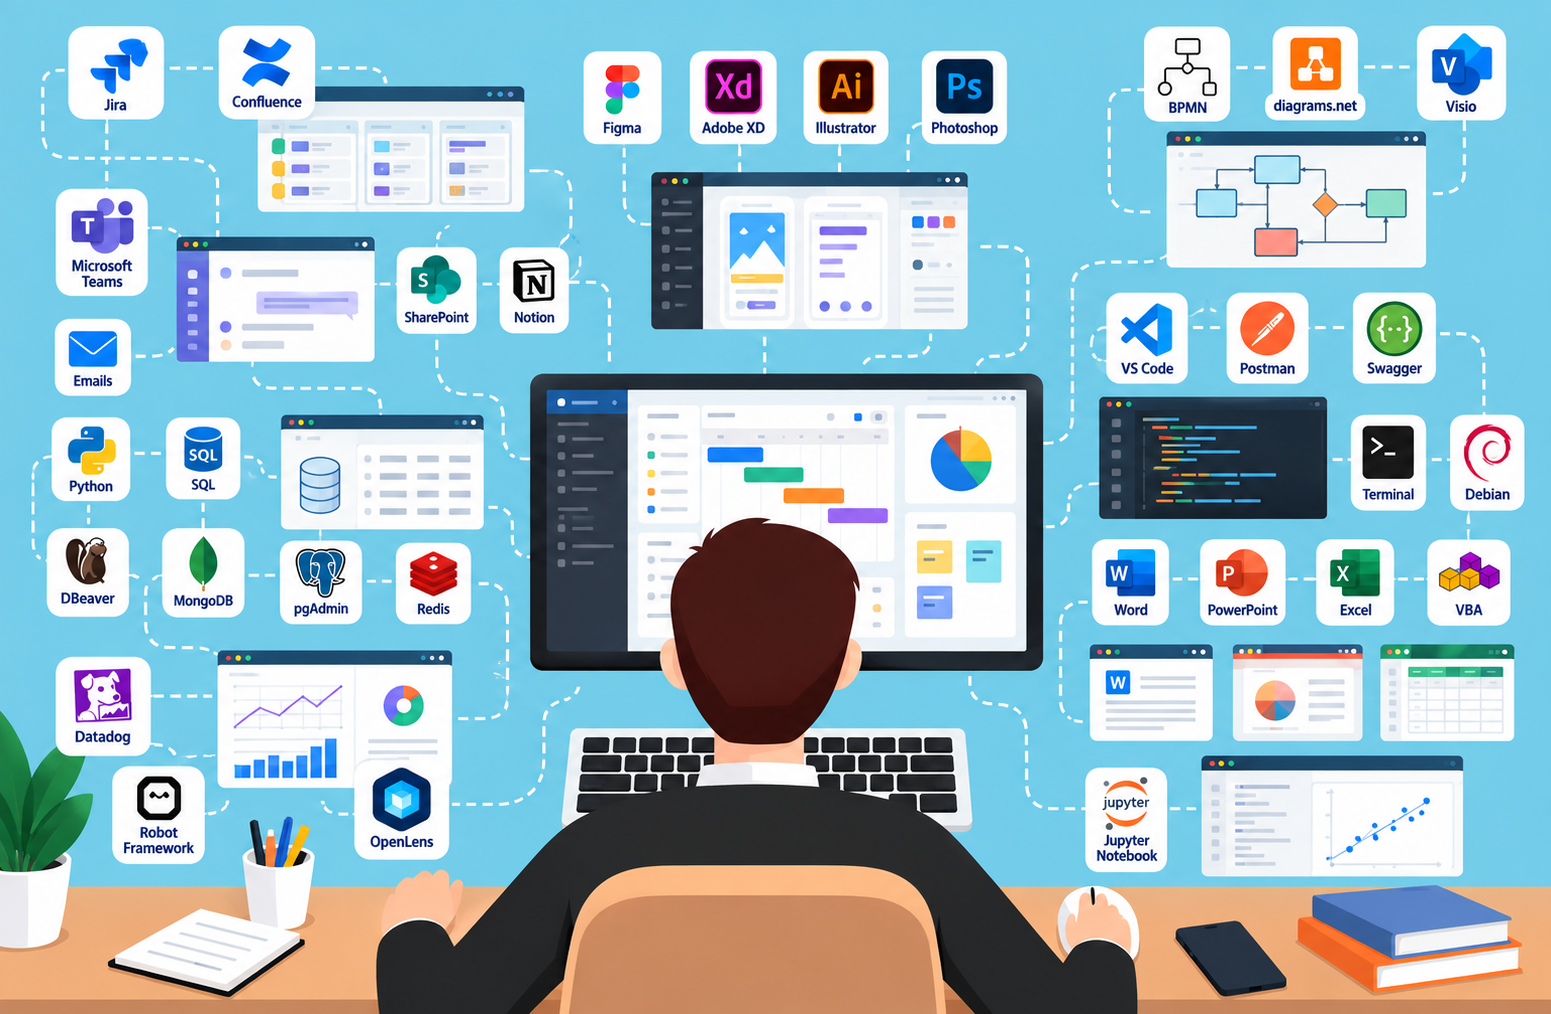
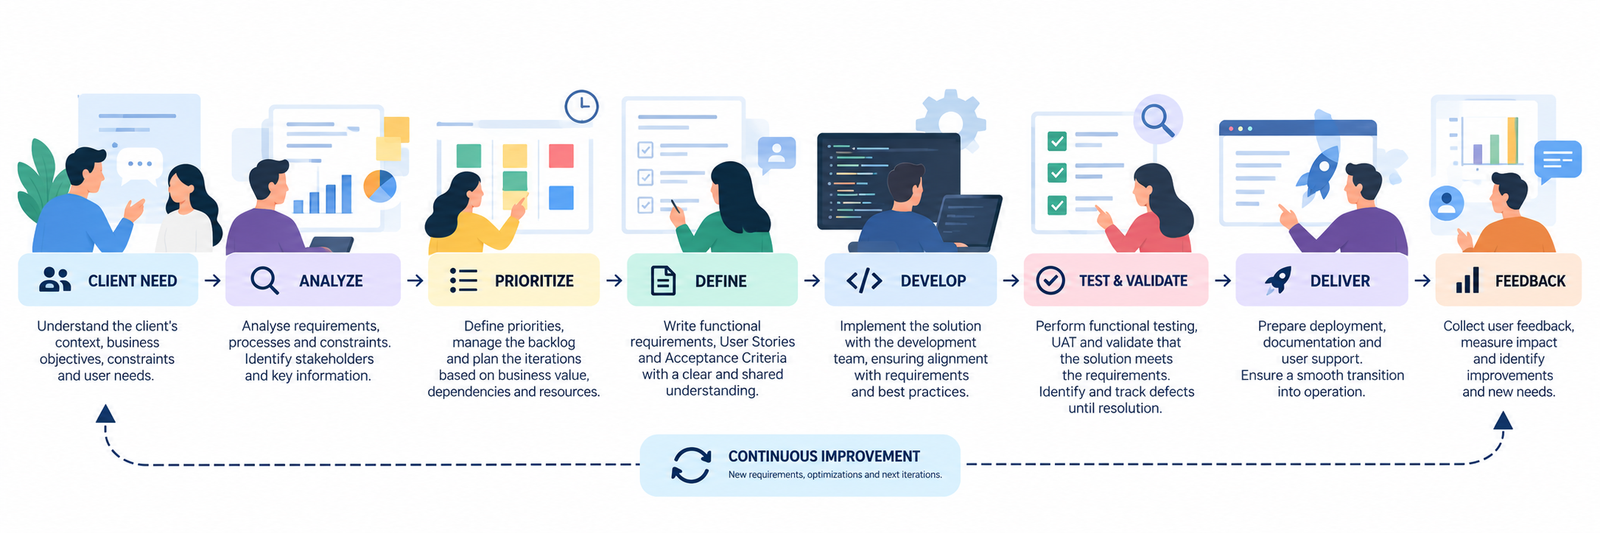
Here are some of the core principles I have developed and learned throughout my experience as a Business Analyst consultant and in Agile project management.
Understand the Client
Every project starts with understanding the client’s objectives, business needs, processes and constraints.
I work at the intersection of business and technology to clarify expectations and translate them into requirements that can be understood by both business stakeholders and technical teams.
Prioritize
Client projects often involve numerous requests, limited resources and changing priorities.
I helped identify what is critical, valuable and achievable, taking into account business priorities, dependencies, technical constraints and deadlines.
The objective is to maintain a clear and actionable backlog while keeping the project aligned with its roadmap. It was also important for me to find a coherence between every User Stories and align all requirements.
It may sound obvious, but I have encountered this situation many times when I was brought into a project to reinforce an Agile functional team that was struggling to manage its backlog.
User Stories should not contain contradictory acceptance criteria, nor should the business rules be misaligned with those criteria. It is also essential to ensure that these rules are consistent, complete, and properly aligned with both API interfaces and user interfaces.
Above all, this requires meticulous requirements writing and review. High-quality specifications help prevent misunderstandings, functional errors, inconsistencies, and anomalies further down the line.
It also requires maintaining a global view of the product rather than looking at each User Story in isolation. To address this, I introduced a functional review of all User Stories before backlog estimation and prioritization, and before the start of each sprint. This additional review helped identify inconsistencies early and reduce avoidable issues during development and testing.
From an AI perspective, part of this work can be supported by an LLM: identifying and extracting requirements, comparing business rules, detecting potential inconsistencies, and improving the wording of User Stories to make them clearer and easier to understand. However, human review remains essential to ensure that the requirements are functionally accurate, complete, and aligned with the overall product vision.
Coordinate
Digital projects involve multiple stakeholders: clients, business teams, Product Owners, developers, UX designers and testers.
Each stakeholder may speak their own language, have their own objectives, priorities, and perspective on the project.
Being a Business Analyst means understanding the needs and challenges of each business stakeholder, bridging the gaps between them, and creating a common language that enables everyone to work together.
The goal is not simply to gather requirements, but to align different perspectives and make sure they converge towards one shared objective: moving the project forward and delivering a solution that creates value for everyone involved.
Agile ceremonies and working documents provide the framework that makes this alignment possible. They create shared spaces, common references, and regular opportunities for stakeholders to communicate, challenge assumptions, clarify requirements, and align their perspectives.
Daily meetings, backlog refinement, sprint planning, reviews, retrospectives, User Stories, acceptance criteria, and other shared artefacts are not just Agile rituals or documentation. They are tools for creating a common language and bringing different stakeholders together around the same product vision and objectives.
I help coordinate these different perspectives through Agile ceremonies, workshops, discussions and regular follow-ups, ensuring that everyone maintains a shared understanding of the objectives and requirements.
This creates a shared understanding between the client, business teams and developers before implementation begins.
Respect the Specification
In a client environment, the scope and requirements provide the reference for delivery.
Each feature needs to be checked against its expected behaviour and Acceptance Criteria. When requirements evolve, changes need to be identified, discussed and integrated into the project in a controlled way.
One of the best ways to ensure that a specification is properly implemented is to prepare the test campaign directly from its acceptance criteria, without overlooking a single one.
This requires both a user perspective and a technical perspective.
From the user perspective, the goal is to identify and test all relevant use cases and user journeys. From a technical perspective, it means anticipating failure scenarios, validating error handling, and testing the API interfaces and underlying processes that users do not directly see.
Testing should therefore not be treated as a final step in the development process. It is a way to verify that the specification has been correctly understood, implemented, and translated into a reliable product.
This helps maintain alignment between client expectations and delivered functionality.
Deliver
Once development and validation are complete, the feature can be presented and delivered to the client.
Delivery also involves preparing the necessary documentation, communication, deployment activities and user support to ensure a smooth transition into operation.
Learn & Improve
Every delivery creates the next opportunity.
Once a feature is delivered, feedback from the client and users provides new information about the product.
New requirements, improvement opportunities and lessons learned can then feed the backlog and influence future iterations.
Personal project – Swift Development learning
From Scientific Knowledge to Digital Solution
Designing and developing a medical digital tool grounded in scientific evidence
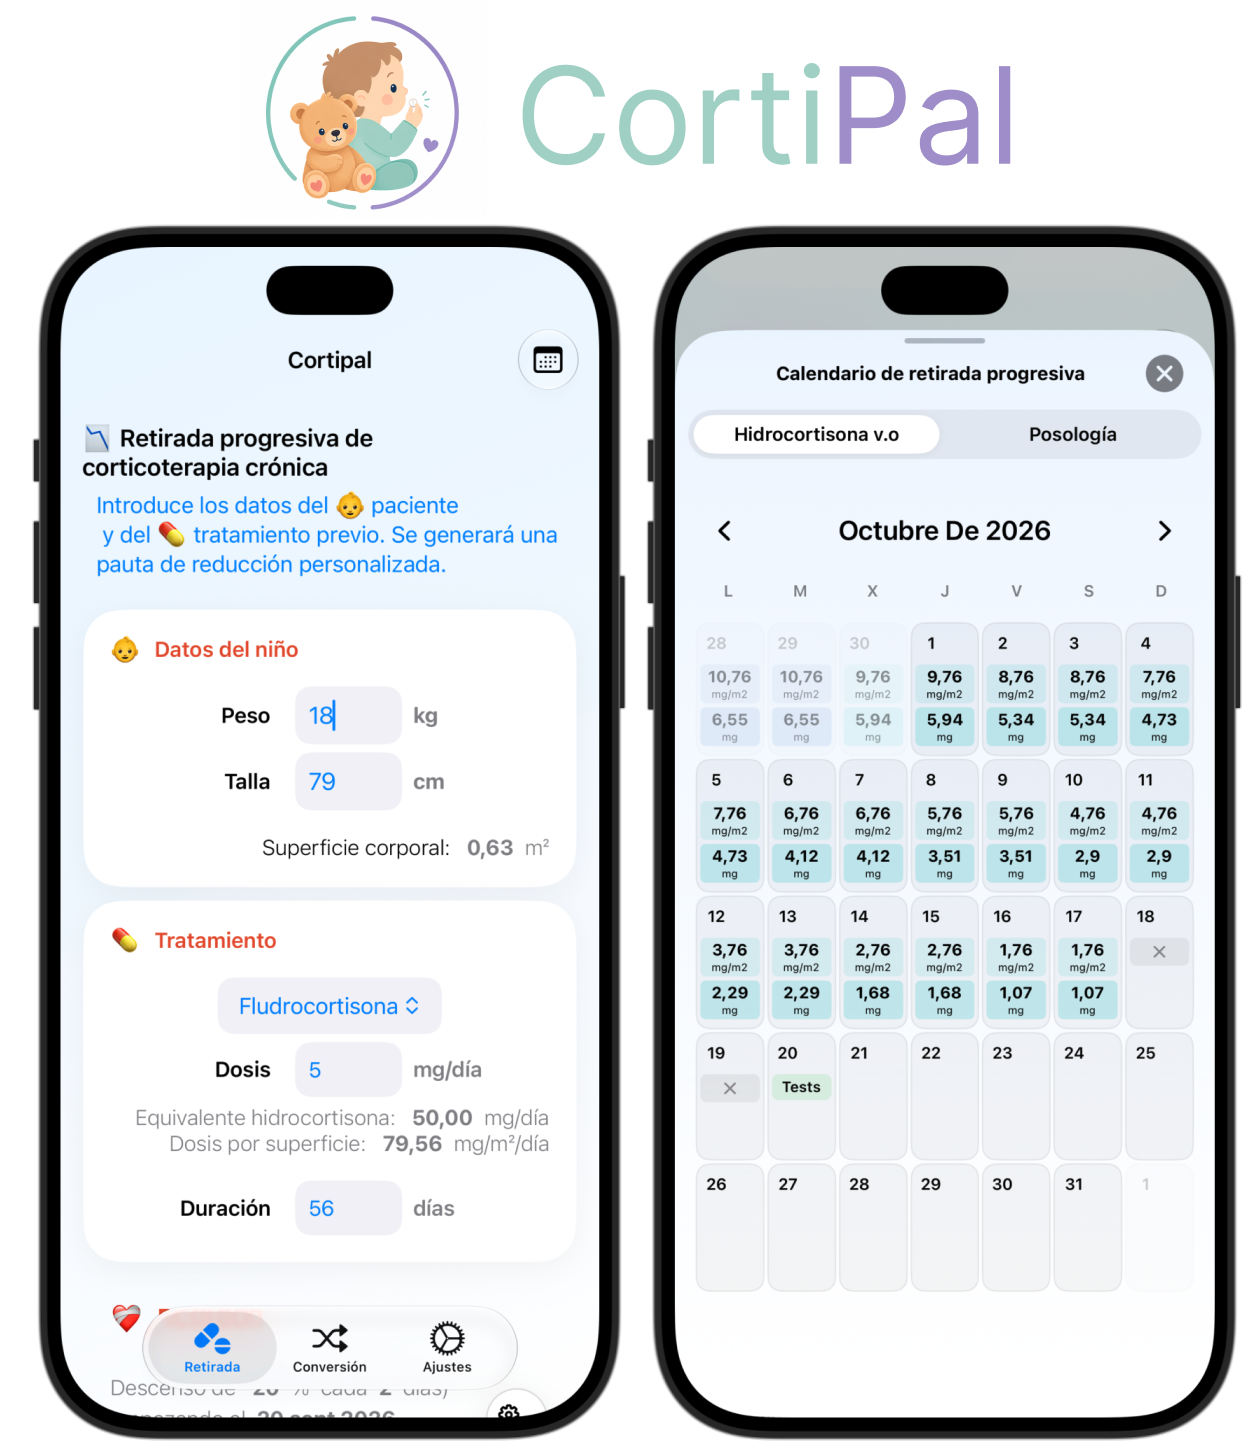
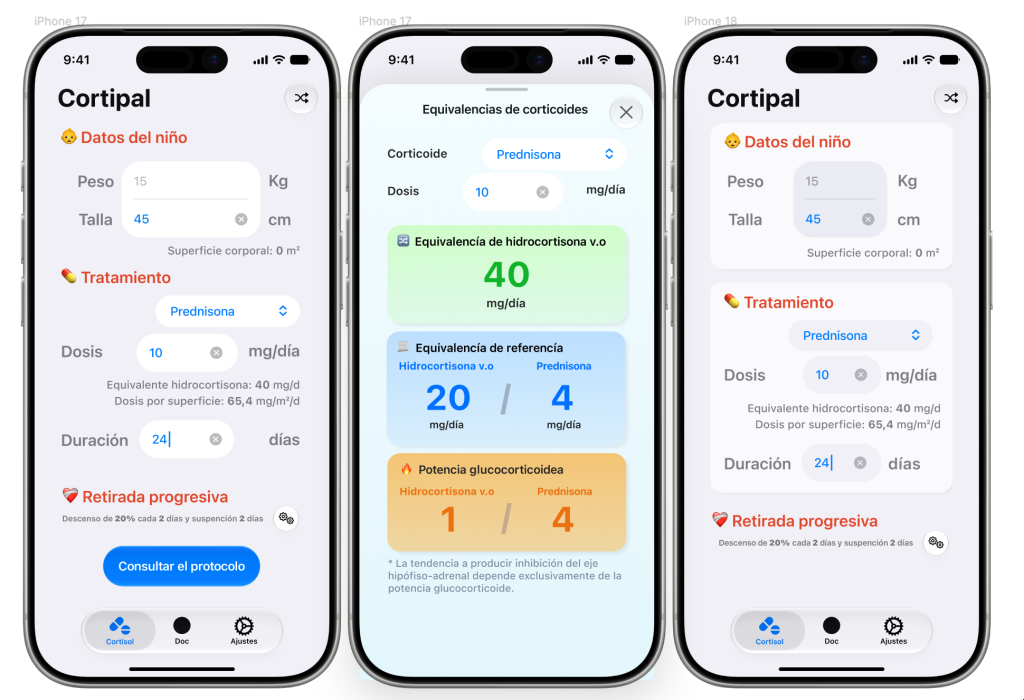
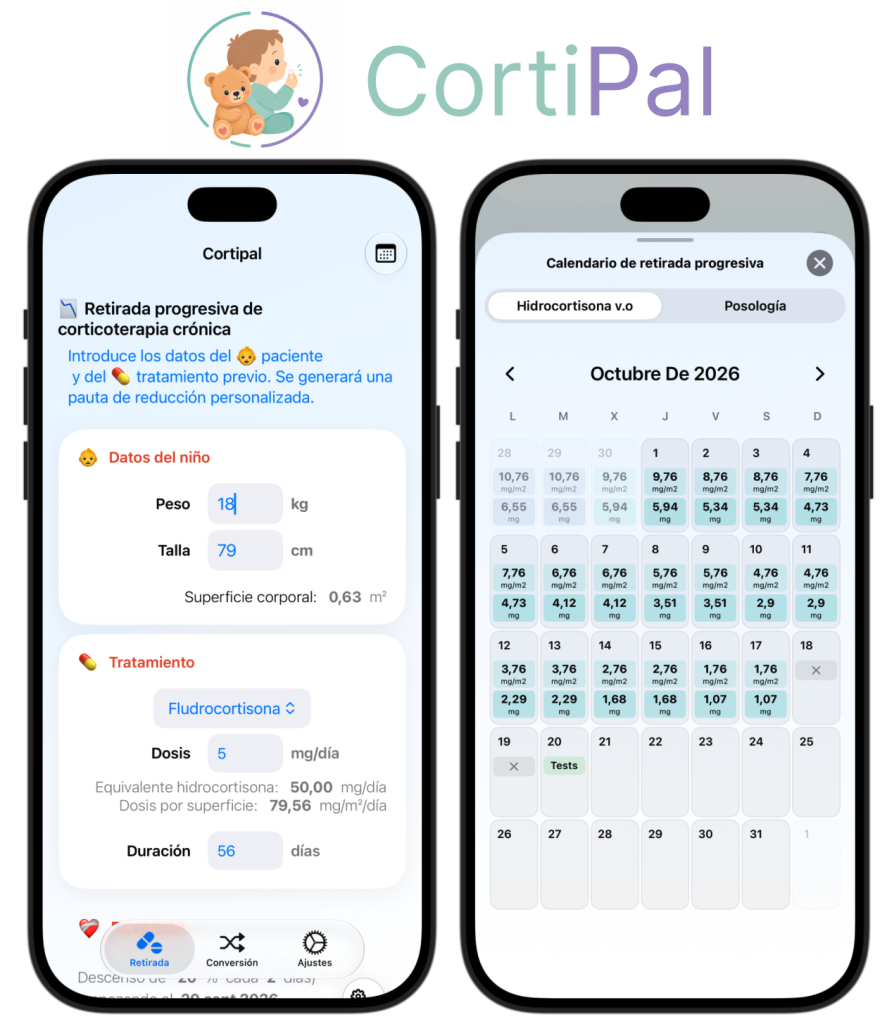
CortiPal is a digital solution designed to support healthcare professionals in the management of corticosteroid treatment in palliative care. The project started from a scientific publication, which served as the foundation for the medical and functional requirements. I translated the scientific methodology and medical needs into functional logic, UX/UI design and an interactive digital experience. The solution was then developed, tested and iterated to ensure consistency with both the scientific source and user needs.
Key Challenges
Translating Scientific Knowledge
Understanding the Medical Context
Ensuring Functional Accuracy
Balancing Requirements & Usability
Development and testing
01 – A software solution translating medical knowledge into a digital experience
The next step was to identify the functional and medical requirements of the solution.
The objective was to understand how healthcare professionals would use the tool, what information they need, which inputs are required and how the scientific rules should be applied.
The scientific source remained the reference point throughout the design and development process.
02 – Functional Design
The medical and functional requirements were translated into a structured user journey.
I defined the required inputs, calculation logic, outputs, warnings and interactions to ensure that the digital workflow remained consistent with the underlying medical methodology.
03 – UX & UI Design
The interface was designed to make the underlying medical logic clear, understandable and easy to navigate.
Before designing the interface, I focused on how information should be presented and entered. I defined the required inputs, data structure and interaction patterns to make data entry clear and intuitive.
I identified the essential information required by the user and separated it from secondary features that could be introduced during a later iteration. This helped maintain a focused interface while addressing the key business and usability requirements.
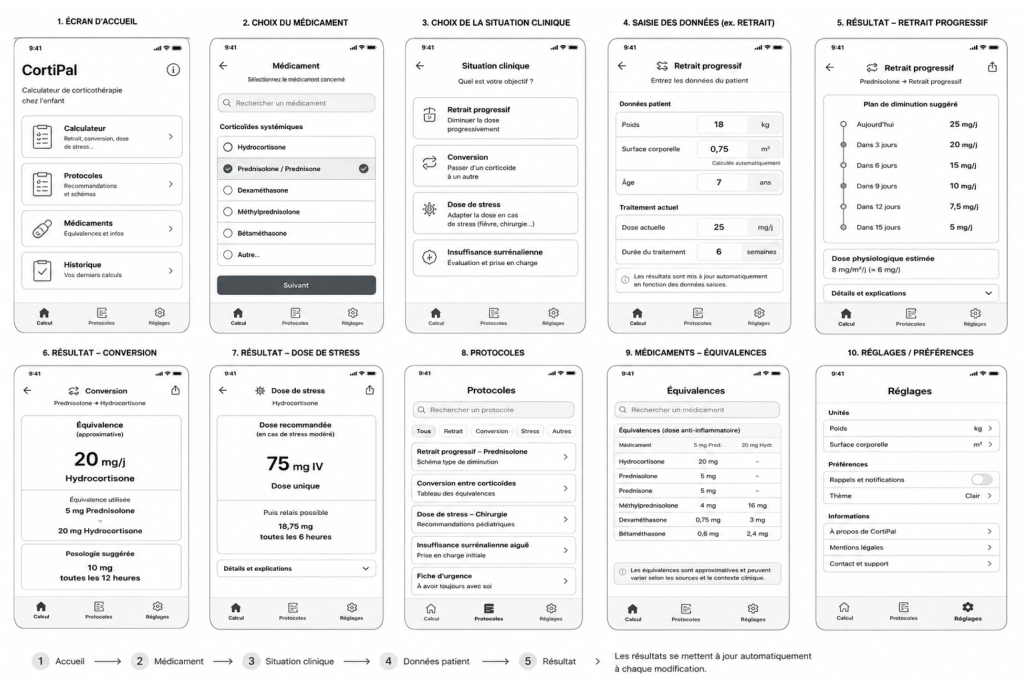
I created low-fidelity wireframes to explore different layouts, interactions and user flows. I also used AI as an ideation partner to generate and challenge design alternatives before selecting the most relevant concepts.
Wireframes
Once the main concepts were established, I moved to Figma to create a realistic, interactive prototype. The design was reviewed with a physician working in the field to validate its usability, clarity and alignment with real-world medical needs.
Figma
04 – Development
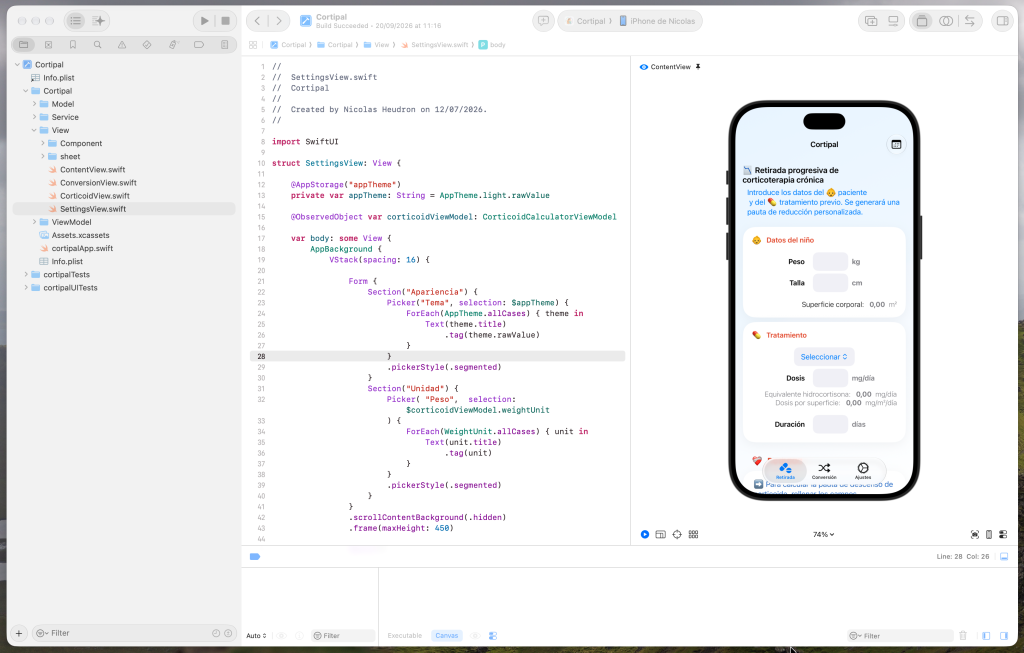
Once the functional and visual design was established, I developed the application and translated the defined rules into a working digital experience.
Particular attention was given to ensuring that the implemented behaviour remained consistent with the defined requirements and scientific source.
Xcode
05 – Validation & Testing
Testing focused not only on the interface, but also on the functional logic and expected outputs.
Inputs, calculations, edge cases and user interactions were checked against the defined requirements and the scientific reference.
06 – Iteration & Improvement
Testing and feedback made it possible to identify improvements in both the user experience and the functional behaviour.
The solution was progressively refined while maintaining alignment with the medical requirements and scientific foundation of the project.
07 – Final solution
* CortiPal is based on a real medical publication that is not publicly available. To protect the confidentiality of the medical protocol and its underlying information, only selected screens and non-sensitive elements are presented in this case study.
My main project
Industrial Maintenance and Operational Readiness Supported by Software Solutions
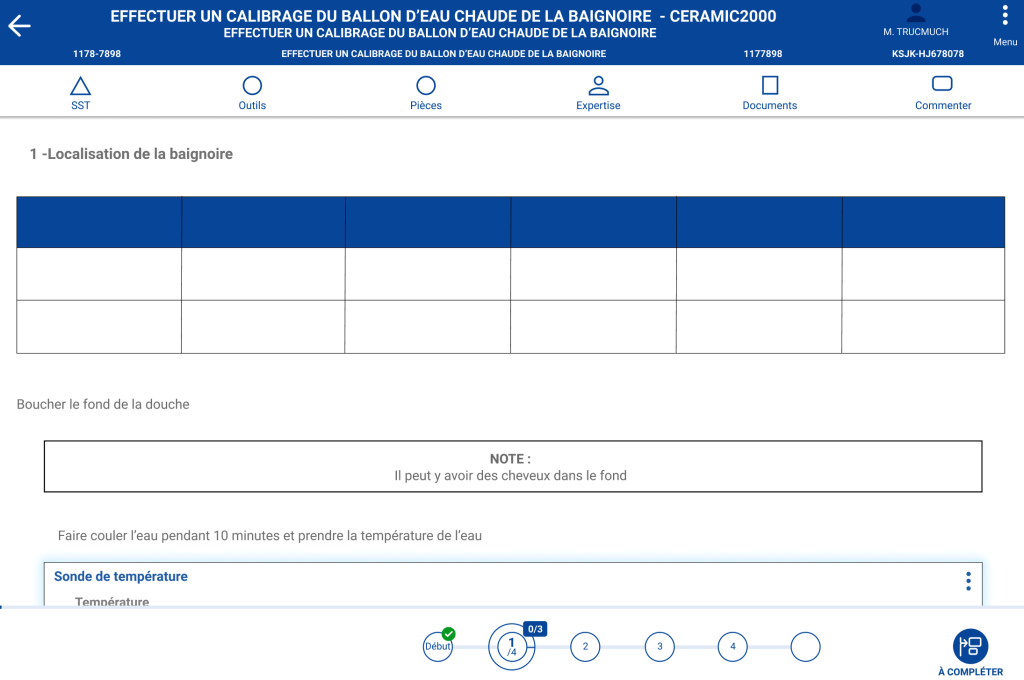
I contributed to the design and development of a digital solution for industrial maintenance, aimed at improving the management of maintenance activities and operational procedures. From understanding business and user needs to defining functional requirements, designing workflows and supporting implementation, I worked at the intersection of business, technology and users.
Key Challenges
Standardize maintenance processes
Improve operational efficiency
Enable continuous improvement through feedbacks
Support decision-making
Ensure quality and compliance
The software solution based on the processes industry
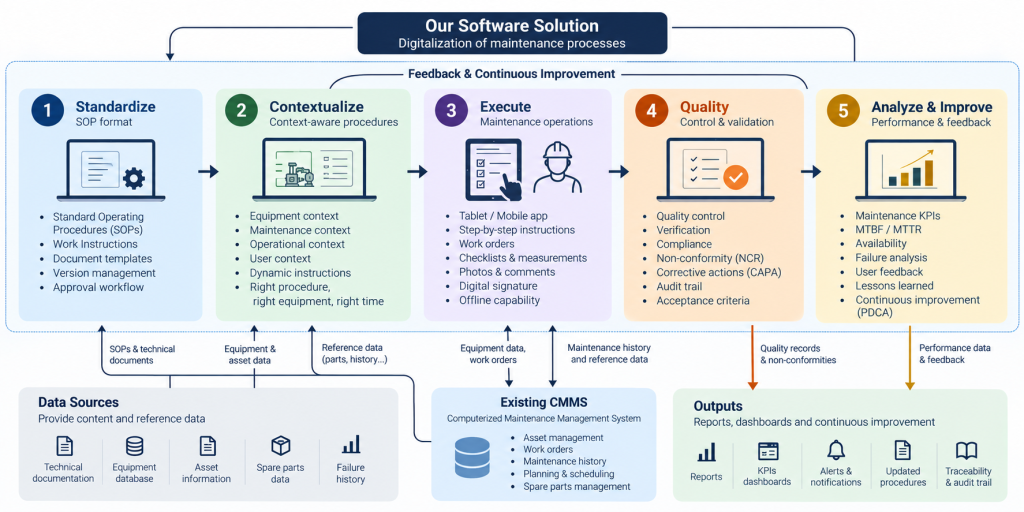
The software solution digitalizes the maintenance process through five interconnected stages: standardization, contextualization, execution, quality control, and continuous improvement.
It relies on existing data sources of the information system of the company, and integrates with the CMMS already in place, enriching the information available to users without replacing the existing system.
From standardized procedures to field execution, quality validation and performance analysis, the solution creates a continuous feedback loop that helps improve both maintenance operations and procedures over time.
Design process
01 – Roadmap
The digital roadmap is defined with the Digital Transformation team, management and business representatives to identify key priorities, digitalization opportunities and strategic features.
02 – Process discovery
Based on the roadmap, I analyse existing processes with process owners and users to identify business needs, pain points and opportunities for digitalization.
03 – User Research & Needs Analysis
Through user interviews and functional analysis, I translate these needs into requirements, User Stories and Acceptance Criteria, creating a shared understanding between business, users and development teams.
04 — Design and prototyping
Figma design
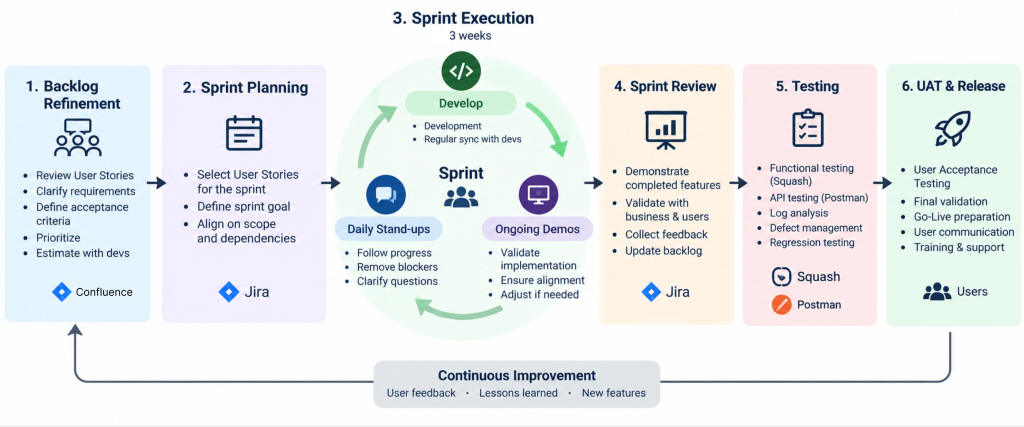
I design the solution using a Design System and Figma, creating interactive prototypes and testing different approaches with users. Their feedback helps refine both the UX and the functional requirements.
05 — Agil process
Once validated, User Stories are finalized and prioritized during Backlog Refinement. I work closely with developers throughout the sprint to clarify requirements and ensure alignment through regular demos.
06 — Validation
The delivered features go through functional testing, using tools such as Squash, Postman and log analysis. Defects are identified, prioritized and followed through to resolution.
07 — Deploy & Adopt
After functional validation, users perform UAT to confirm that the solution meets their operational needs. Once validated, we prepare the Go-Live, communicate the release and support users through training.
08 — Improve
User feedback, testing results and operational experience feed the backlog and future iterations, creating a continuous improvement cycle.